Intro
Packages
library(tidyverse)
## ── Attaching packages ─────────────────────────────────────── tidyverse 1.3.1 ──
## ✓ ggplot2 3.3.5     ✓ purrr   0.3.4
## ✓ tibble  3.1.3     ✓ dplyr   1.0.7
## ✓ tidyr   1.1.3     ✓ stringr 1.4.0
## ✓ readr   2.0.1     ✓ forcats 0.5.1
## Warning: package 'ggplot2' was built under R version 4.1.1
## Warning: package 'readr' was built under R version 4.1.1
## ── Conflicts ────────────────────────────────────────── tidyverse_conflicts() ──
## x dplyr::filter() masks stats::filter()
## x dplyr::lag()    masks stats::lag()
library(lubridate)
##
## Attaching package: 'lubridate'
## The following objects are masked from 'package:base':
##
##     date, intersect, setdiff, union
library(ggthemes)
library(countrycode)
library(OECD)
## Warning: package 'OECD' was built under R version 4.1.1

theme_set(theme_minimal(base_size = 16))
Data
Use OECD package to get data
dataset <- "HEALTH_LTCR"

dstruc <- get_data_structure(dataset)

str(dstruc)
## List of 7
##  $ VAR_DESC   :'data.frame': 7 obs. of  2 variables:
##   ..$ id         : chr [1:7] "VAR" "UNIT" "COU" "YEA" ...
##   ..$ description: chr [1:7] "Variable" "Measure" "Country" "Year" ...
##  $ VAR        :'data.frame': 13 obs. of  2 variables:
##   ..$ id   : chr [1:13] "LTCW" "LTWF" "LTWFFWHC" "LTWFFWHO" ...
##   ..$ label: chr [1:13] "Long-term care workers" "Long-term care workers: formal sector" "Formal LTC workers (Head counts)" "Formal LTC workers at home (Head counts)" ...
##  $ UNIT       :'data.frame': 29 obs. of  2 variables:
##   ..$ id   : chr [1:29] "NURPCAMT" "IWP65N" "PCFORFPF" "TOTNURNB" ...
##   ..$ label: chr [1:29] "Total (nurses and personal carers)" "Per 100 population aged 65 years old and over" "Females per 100 population aged 65 years old and over" "Total nurses (at home and in institutions)" ...
##  $ COU        :'data.frame': 45 obs. of  2 variables:
##   ..$ id   : chr [1:45] "AUS" "AUT" "BEL" "CAN" ...
##   ..$ label: chr [1:45] "Australia" "Austria" "Belgium" "Canada" ...
##  $ YEA        :'data.frame': 61 obs. of  2 variables:
##   ..$ id   : chr [1:61] "1960" "1961" "1962" "1963" ...
##   ..$ label: chr [1:61] "1960" "1961" "1962" "1963" ...
##  $ OBS_STATUS :'data.frame': 19 obs. of  2 variables:
##   ..$ id   : chr [1:19] "b" "d" "e" "B" ...
##   ..$ label: chr [1:19] "Break in series" "Deviation from OECD definition" "Estimate" "Break" ...
##  $ TIME_FORMAT:'data.frame': 5 obs. of  2 variables:
##   ..$ id   : chr [1:5] "P1Y" "P1M" "P3M" "P6M" ...
##   ..$ label: chr [1:5] "Annual" "Monthly" "Quarterly" "Half-yearly" ...
dstruc$UNIT
## id label
## 1 NURPCAMT Total (nurses and personal carers)
## 2 IWP65N Per 100 population aged 65 years old and over
## 3 PCFORFPF Females per 100 population aged 65 years old and over
## 4 TOTNURNB Total nurses (at home and in institutions)
## 5 TOTPCAMB Total personal carers (at home and in institutions)
## 6 NURSESQT Nurses by setting
## 7 PSOCARMB Personal carers by setting
## 8 IWP65QQT Nurses per 100 population aged 65 years old and over
## 9 IWP65P Personal carers per 100 population aged 65 years old and over
## 10 NOMBRENB Number
## 11 LTCOVRNB Per 1 000 population aged 65 years old and over
## 12 FEM017YF Females, aged 0-17 years old
## 13 FEM65PPF Females, aged 65 years old and over
## 14 PRFM65PF Females, % of total recipients aged 65 years old and over
## 15 FEM80PPH Females, aged 80 years old and over
## 16 PRFM80PH Females, % of total recipients aged 80 years old and over
## 17 MEN017YM Males, aged 0-17 years old
## 18 MEN65PMT Males, aged 65 years old and over
## 19 PRHO65MT Males, % of total recipients aged 65 years old and over
## 20 MEN80PDU Males, aged 80 years old and over
## 21 PRHO80DU Males, % of total recipients aged 80 years old and over
## 22 TOTAGENB Total, all ages
## 23 PRTTTTNB % of total population, all ages
## 24 TOT017YT Total, aged 0-17 years old
## 25 TOT064EF Total, aged 0-64 years old
## 26 TOT65PQT Total, aged 65 years old and over
## 27 PRTT65QT Total recipients over 65, % of total population aged 65+
## 28 TOT80PEV Total, aged 80 years old and over
## 29 PRTT80EV Total recipients over 80, % of total population aged 80+dstruc$VAR
## id label
## 1 LTCW Long-term care workers
## 2 LTWF Long-term care workers: formal sector
## 3 LTWFFWHC Formal LTC workers (Head counts)
## 4 LTWFFWHO Formal LTC workers at home (Head counts)
## 5 LTWFFWIN Formal LTC workers in institutions (Head counts)
## 6 LTWFFWFT Formal LTC workers (FTE)
## 7 LTWFFWFH Formal LTC workers at home (FTE)
## 8 LTWFFWFI Formal LTC workers in institutions (FTE)
## 9 BLTC Beds in residential long-term care facilities
## 10 BLTCLTCN Beds in residential long-term care facilities
## 11 LTCI Long-term care recipients
## 12 LTCILTIT LTC recipients in institutions (other than hospitals)
## 13 LTCILTHT LTC recipients at homeltc <- get_dataset("HEALTH_LTCR")Plot 1
ltc %>%
  mutate(obsTime = str_c(obsTime, "0101") %>% ymd(.)) %>%
  filter(obsTime == ymd(20190101)) %>%
  filter(UNIT == "PRTT65QT" & VAR %in% c("LTCILTIT", "LTCILTHT"))  %>%
  mutate(VAR = factor(VAR, levels = c("LTCILTIT", "LTCILTHT"),
                      labels = c("Institution\n(Non-hospital)", "Home")),
         COU = countrycode(COU, origin = "iso3c", destination = "country.name")) %>%
  group_by(COU) %>%
  mutate(totVal = sum(obsValue)) %>%
  ungroup %>%
  ggplot(aes(reorder(COU, -totVal), obsValue, fill = VAR)) +
  geom_col() +
  #geom_hline(yintercept = 7.6) +
  scale_y_continuous(limits = c(0, 40),
                     labels = scales::percent_format(scale = 1),
                     expand = c(0,0.1)) +
  scale_fill_ptol() +
  theme(legend.position = "top",
        plot.caption = element_text(size = 10),
        panel.grid.minor = element_blank(),
        panel.grid.major.x = element_blank(),
        axis.ticks.x = element_line(),
        axis.text.x = element_text(angle = 25, hjust = 1, vjust = 1)) +
  labs(y = "",
       x = "",
       fill = "",
       title = "Percentage of people aged 65+ in receipt of long-term care, 2019",
       subtitle = "OECD countries for which data is available",
       caption = "Source:https://stats.oecd.org/") -> ltc_plot
ltc_plot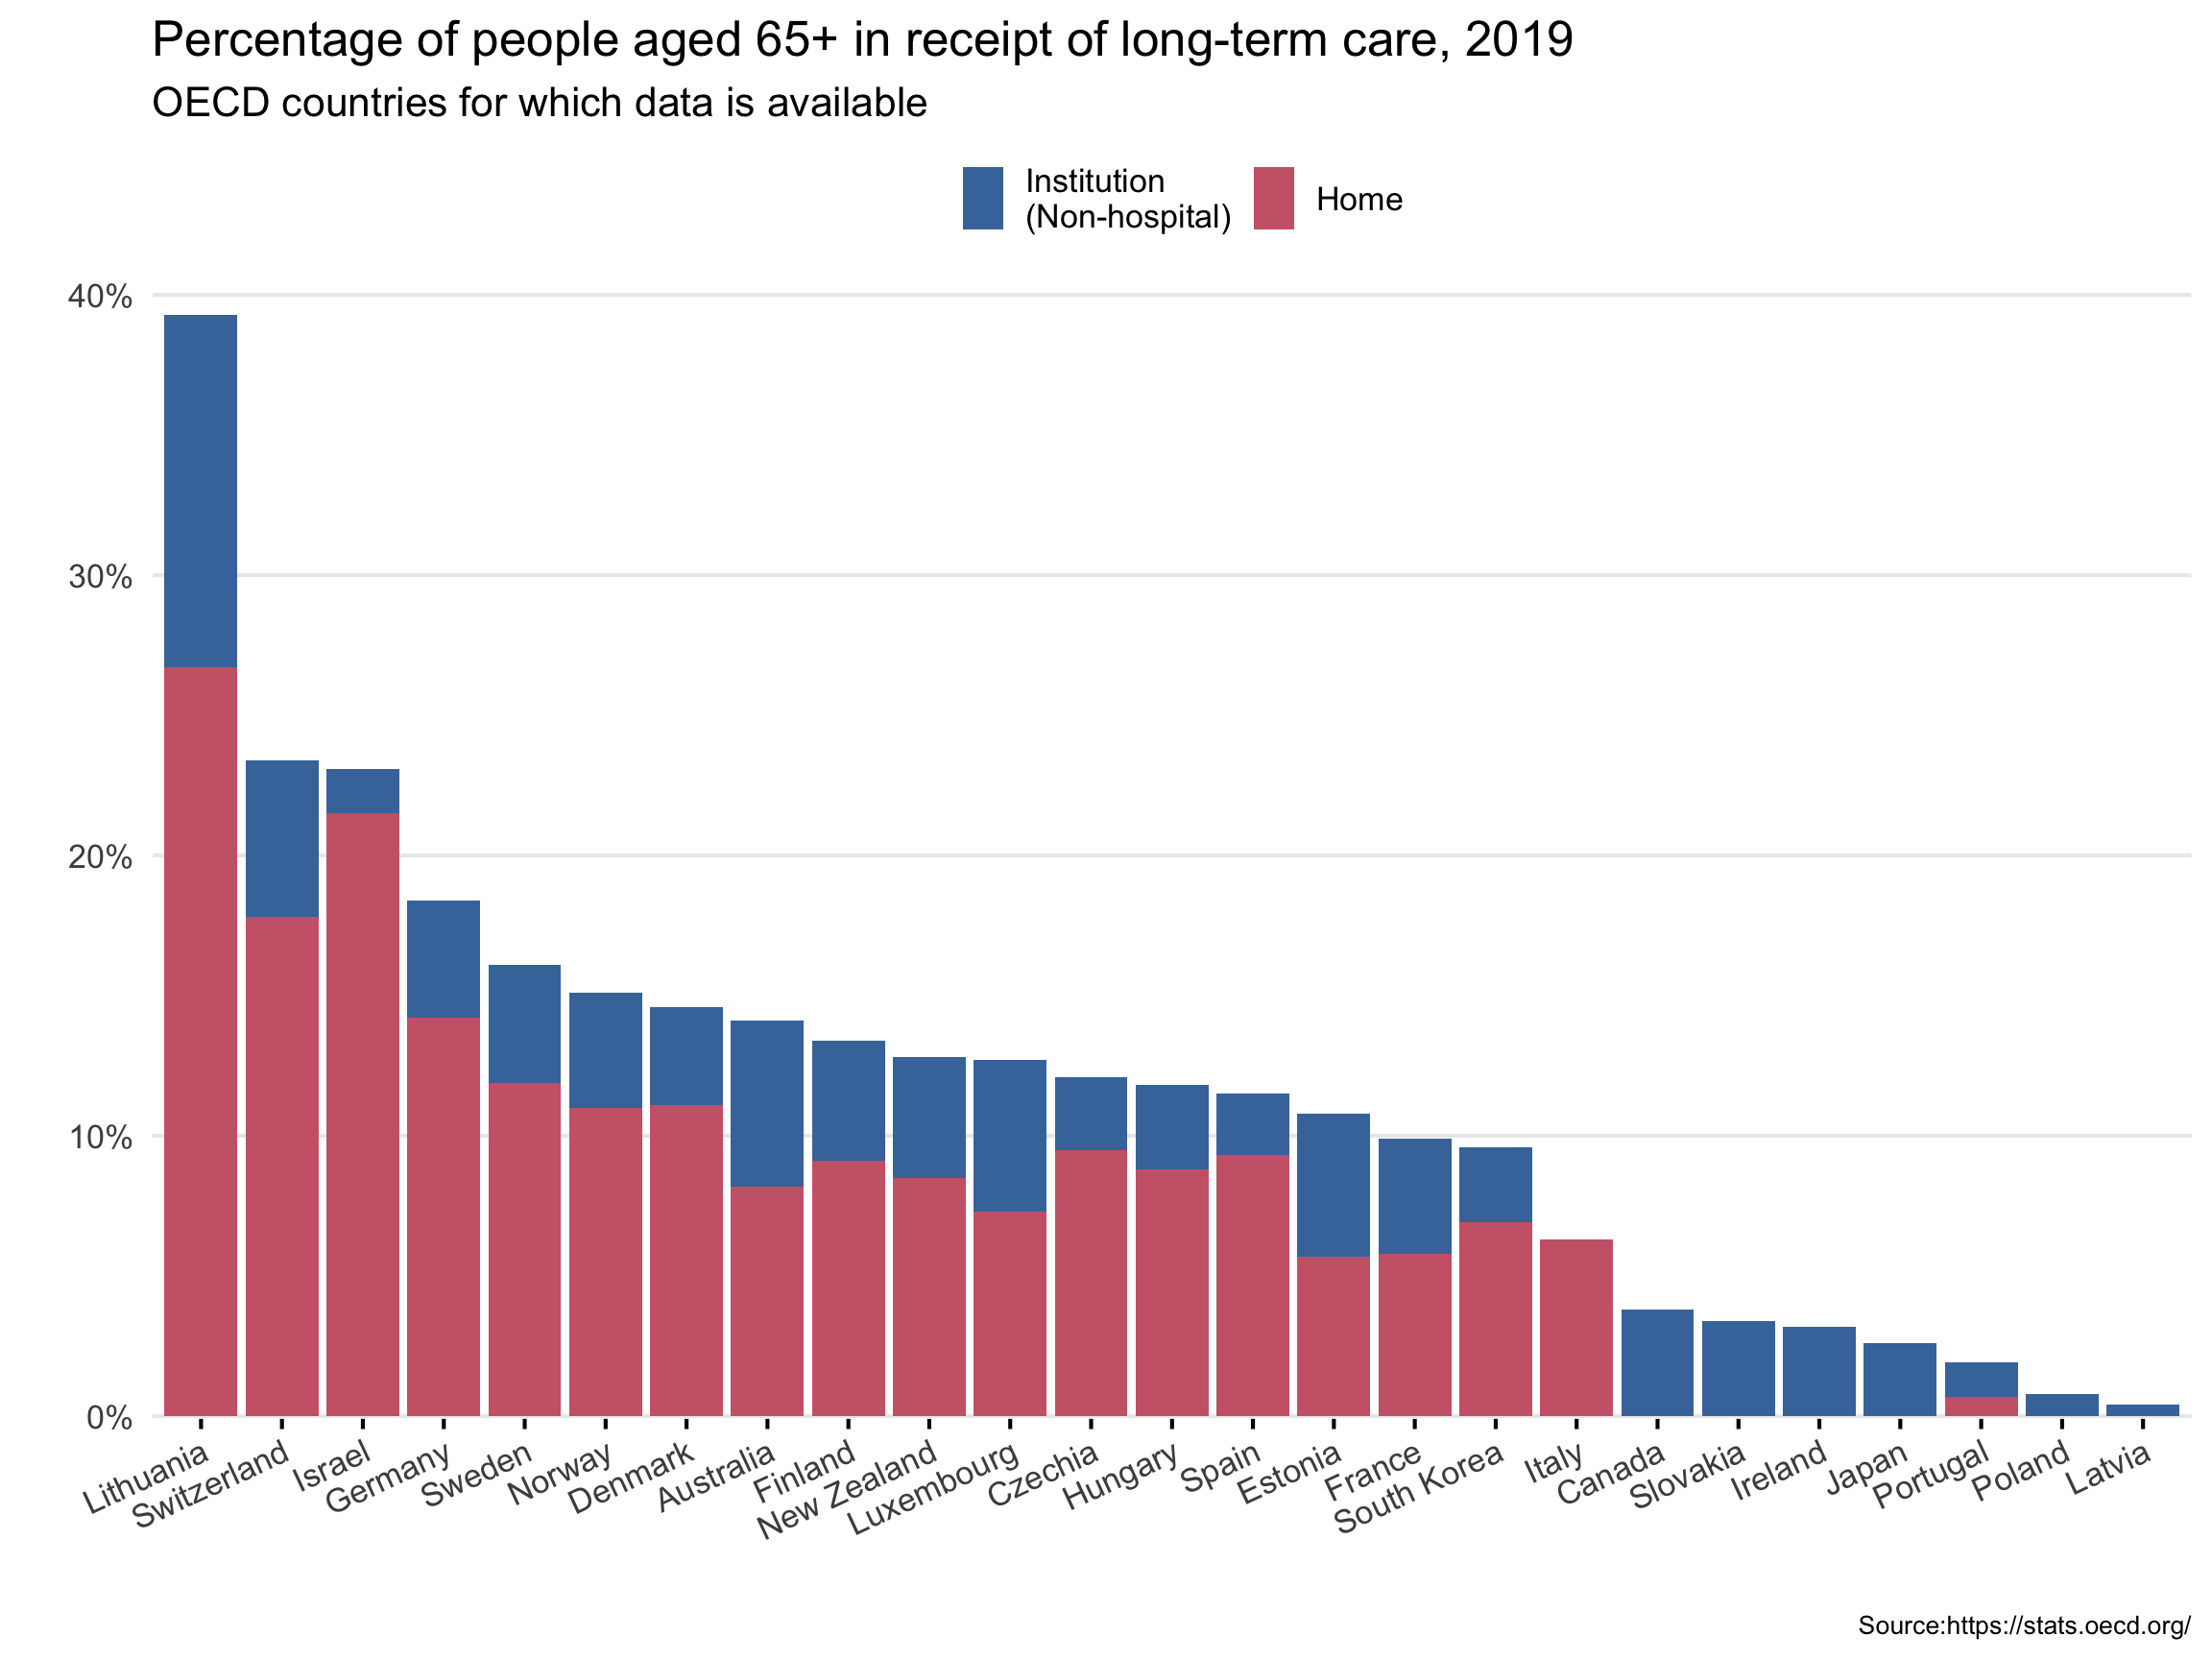
ggsave("ltc_plot.png", ltc_plot, height =9, width = 12)